Analytics
Access
In order to have access to this dashboard, first you need to be on the HomeByMe stack. For Retailers, this is not accessible.
Then you will need to contract an analytic offer. Please refer to your commercial for further information and to subscribe.
Dashboard
This dashboard is an example. Dashboard can be customized regarding the offer bought. But charts, tables will share same behaviour and that is what we will explain here.
On a Legal entity, we can have several dashboards, and inside these dashboards, several tabs to highlight data as configured.
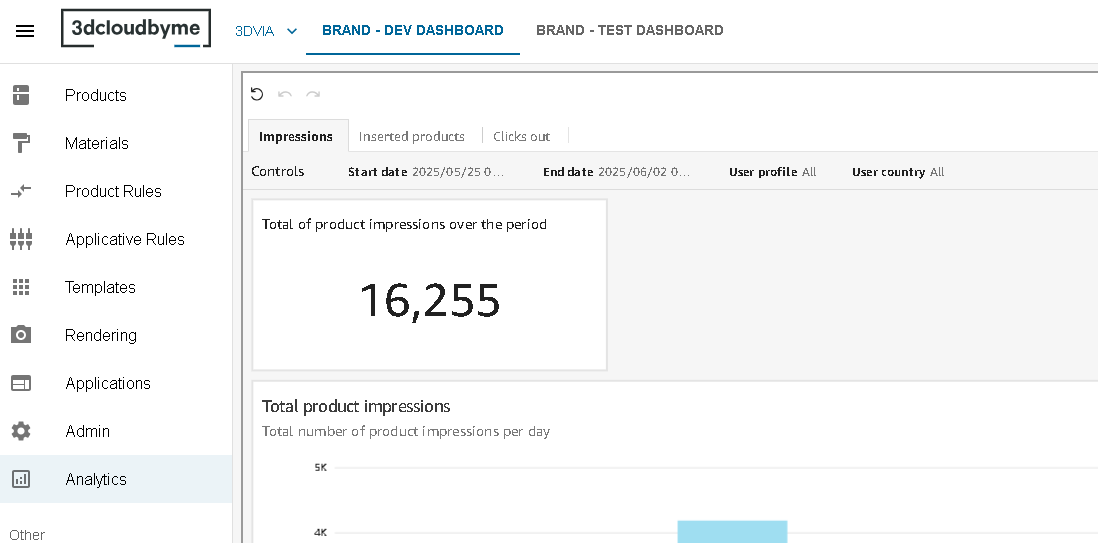
In this example, on first dashboard, first tab, we display the product insertion for the current legal.
Controls
There are several control on the data to display:
- Start date/ End date control the range in which the data will be displayed.
- User profile will filter the projects created by user matching the user profile selected.
- User country will filter the projects created by user in the selected countries.
Chart bar
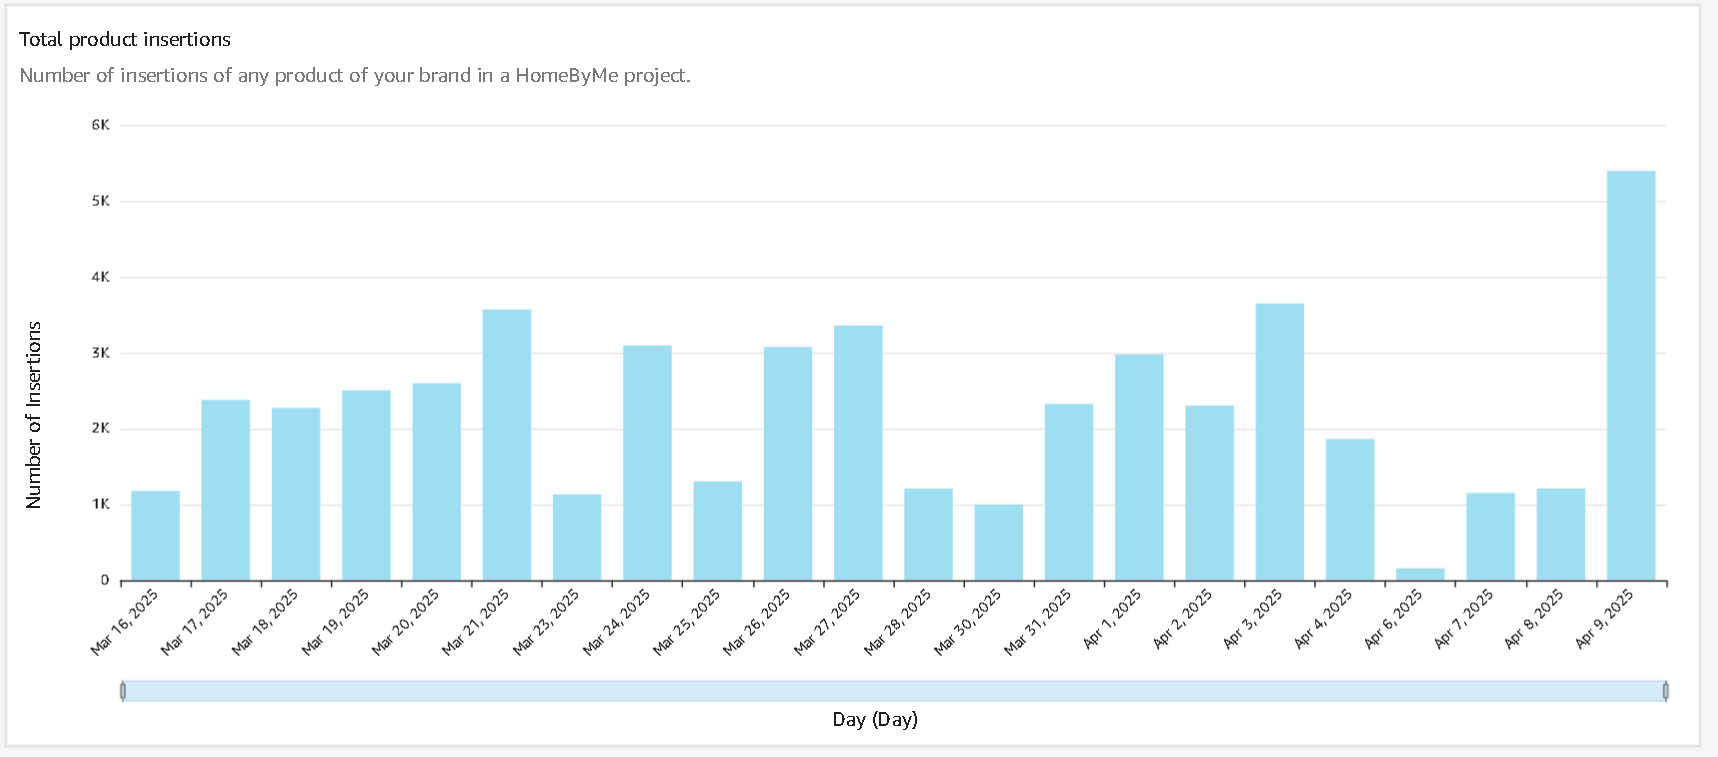
The charts bar shows the amount in y-axis according to the value (here the date) in the x-axis.
Table
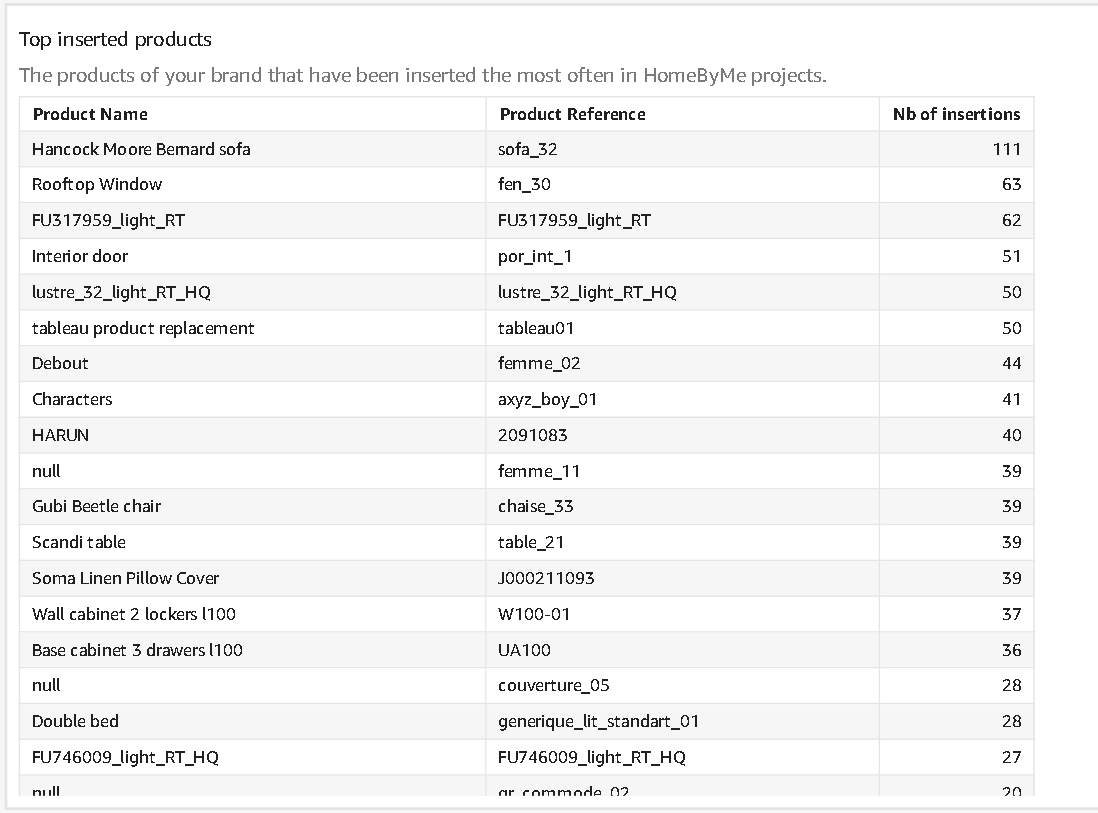
The table shows data in row according to the columns. in the example we can see the product name, product reference and the nb of insertion.
By column, it is possible to change the sorting of the table and on which column the sort is placed. You just have to click on the header to have access to this option.
Pie chart
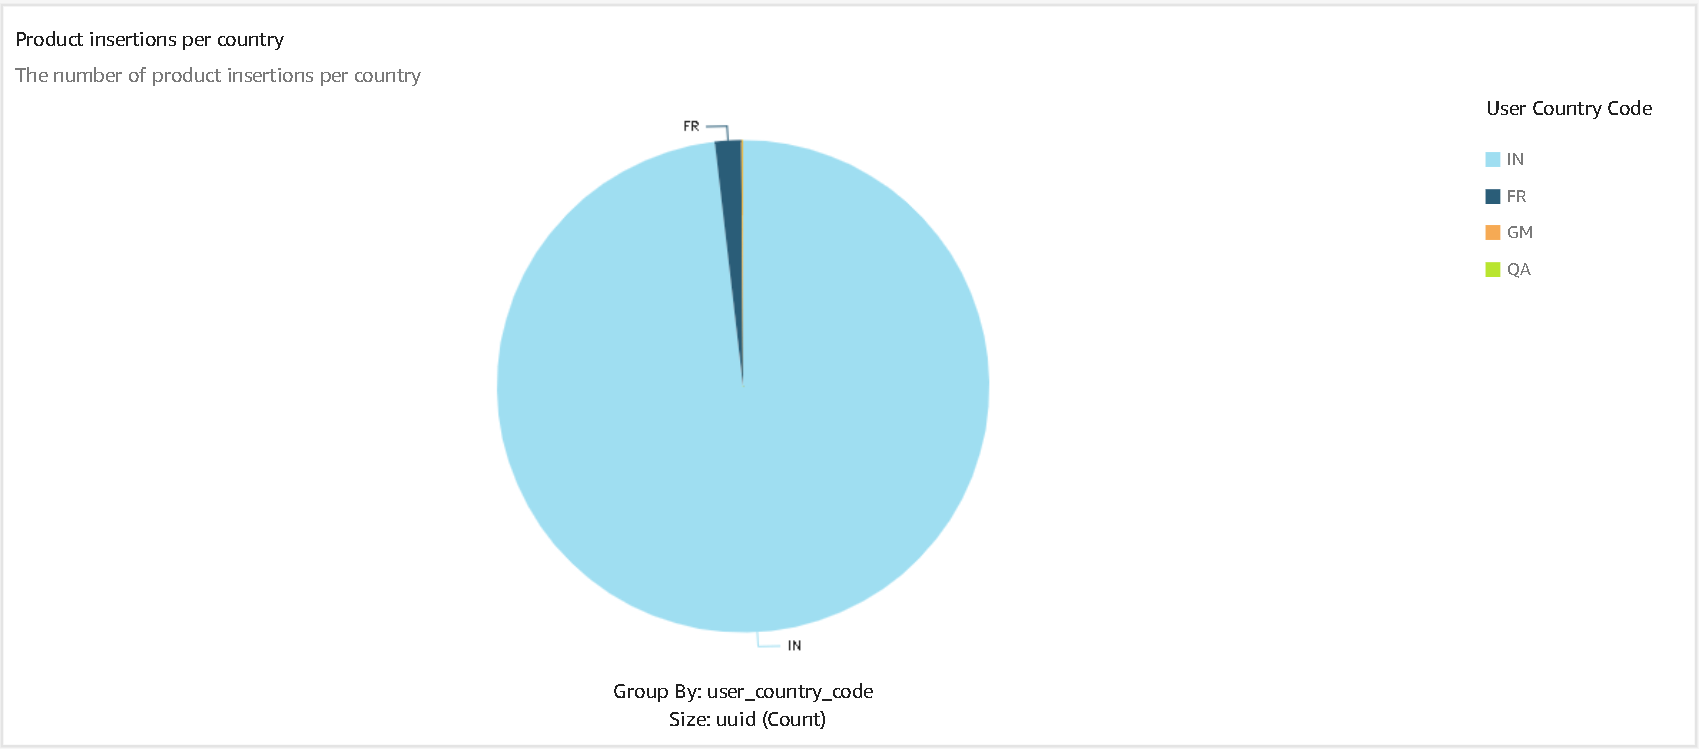
The pie chart shows an amount by a field. here the pie chart shows the amount of product insertion by country.